The following is a basic primer in interpretation of the ECG (EKG). It is intended solely for teaching purposes, and should not be relied upon in clinical decision making.
ECGs can be very confusing, and there are dozens of different methods of interpretation. It's perhaps best if everyone works out their own individual approach, but here's just one approach you can build upon:
|
Of the above steps, the fourth seems counter-intuitive and unnecessary. In fact, it's the most important. As in all medicine, complacence is dangerous. Avoid it!
Now, let's sketch out a systematic approach. Ours is:
Before we move through the systematic approach outlined above, we will outline a few basics. More advanced readers may wish to skip these basics, and move on to the systematic part of the tutorial.
In the above picture, the schematic ECG lead on the right `sees' the (red) vector moving towards it, shown as a positive deflection in the ECG trace; the lead at 90 degrees to this sees nothing!
We assume some knowledge of heart anatomy. Note that the normal heart has, electrically speaking, only two chambers, an atrial and a ventricular `chamber'. Propagation of electrical activity spreads freely within atria and ventricles, but communication between these two chambers is limited to the AV node. Everyone knows that the P wave corresponds to atrial depolarisation, the QRS complex to ventricular depolarisation, and the T wave to repolarisation of the ventricle.
In order to be able to record myocardial activity, the electrocardiograph needs to be able to detect tiny changes in potential on the body surface. We are talking about signals that are often around 1mV, and may be smaller. In addition, we need some reference point to which we relate the potential changes.
Over the years, we have evolved several systems that go to make up the 12-lead ECG. These are:


We can visualise the directions of the various leads --- I points left, and aVF points directly down (in a 'Southward' direction). The other leads are arranged around the points of the compass --- aVL about 30o more north of I, II down towards the left foot, about 60o south of I, and III off to the right of aVF. aVR `looks' at the heart from up and right, so effectively it's seeing the chambers of the heart, and most deflections in that lead are negative.
(a net positive vector in AVR is unusual, and suggests that lead placement was incorrect. If the leads were correctly sited, then think dextrocardia, or some other strange congenital abnormality).
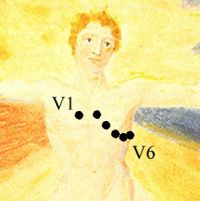
It's usual to group the leads according to which part of the left ventricle (LV) they look at. AVL and I, as well as V5 and V6 are lateral, while II, III and AVF are inferior. V1 through V4 tend to look at the anterior aspect of the LV (some refer to V1 and V2 `septal', but a better name is perhaps the `right orientated leads'). Changes in depolarisation in the posterior aspect of the heart are not directly seen in any of the conventional leads, although "mirror image" changes will tend to be picked up in V1 and V2.
ECG paper is traditionally divided into 1mm squares. Vertically, ten blocks usually correspond to 1 mV, and on the horizontal axis, the paper speed is usually 25mm/s, so one block is 0.04s (or 40ms). Note that we also have "big blocks" which are 5mm on their side.
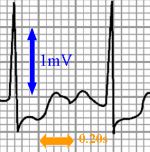
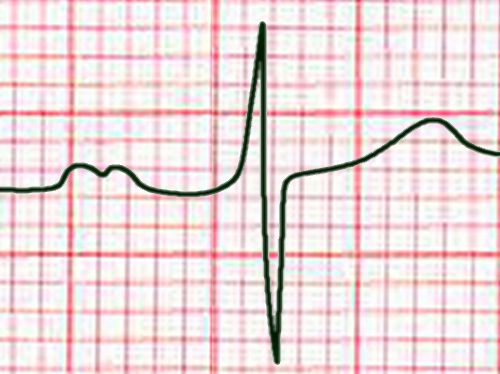
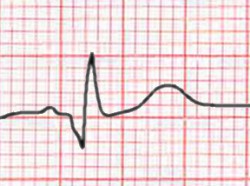
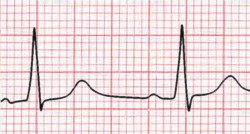
Always check the calibration voltage on the right of the ECG, and paper speed. The following image shows the normal 1mV calibration spike:
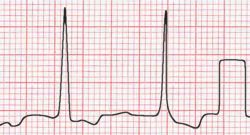
Note that if the calibration signal is not "squared off" then the ECG tracing is either over or under-damped, and should not be trusted.
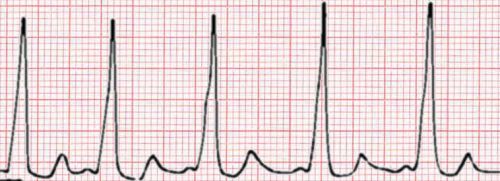
Knowing the paper speed, it's easy to work out heart rate. It's also very convenient to have a quick way of eyeballing the rate, and one method is as follows:
If the number of big blocks is 1, the rate is 300, if it's two, then the rate is 150, and so on. Rates in between these numbers are easy to `interpolate'.
But always remember that in the heart, because we have two electrically `isolated' chambers, the atria and ventricles, that we are really looking at two rates --- the atrial and ventricular rates! It just so happens that in the normal heart, the two are linked in a convenient 1:1 ratio, via normal conduction down the AV node. In disease states, this may not be the case.
Conventionally, a normal heart rate has been regarded as being between 60 and 100, but it's probably more appropriate to re-adjust these limits to 50 -- 90/min. A sinus tachycardia then becomes any heart rate over 90, and bradycardia, less than 50. Note that you have to look at the clinical context -- a rate of 85 in a highly trained athlete may represent a substantial tachycardia, especially if their resting rate is 32/minute! One should also beware of agressively trying to manage low rates in the presence of good perfusion and excellent organ function.
Apart from fit, but otherwise normal individuals, there's a long list of situations where sinus bradycardia occurs, including:
Always consider pain as a possible cause of tachycardia. There's a long list, however:
If the rate is almost exactly 150, always make sure that you are not mistaking atrial flutter with a 2:1 block for sinus tachycardia. A common error.
There is normally a slight degree of chaotic variation in heart rate, called sinus arrhythmia. Sinus arrhythmia is generally a good thing, and loss of this chaotic variation is of ominous prognostic significance. Post myocardial infarction, a metronome-like regularity of the heartbeat is associated with an increased likelihood of sudden death, and just before the onset of ventricular tachycardia (or fibrillation), variability is lost! Absence of any sinus arrhythmia suggests an autonomic neuropathy.
These arise from ectopic atrial foci. Commonly, the ectopic beat always arises at about the same time after the sinus beat!
The ectopic beat usually discharges the SA node, so subsequent beats of SA origin are not in synchrony with the previous sinus rhythm.
If the extrasystole occurs early on, it may find the His-Purkinje system not quite ready to receive an impulse, and a degree of block may be seen. This is termed `aberration'.
Distinguish between an atrial extrasystole, and an atrial escape beat, where the SA node falters, and a subsidiary pacemaker takes over:
(Parenthetically, we didn't draw the P waves very well in the above strip. Don't let this put you off from indentifying the underlying rhythm).
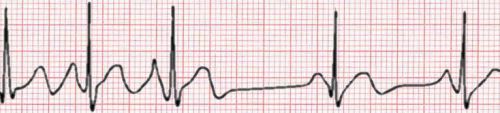
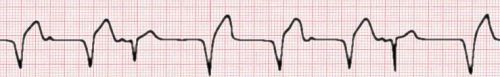
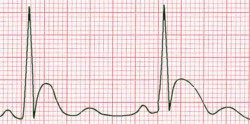
By far the commonest cause of irregular SVT is atrial fibrillation, where the atrial rate is in the region of 450 to 600/min, and the atria really do not contract rhythmically at all. The atrium "fibrillates", writhing like a bag of worms. The conventional view of the pathogenesis of AF is that there are multiple re-entrant `wavelets' moving through the atrial muscle, but recent evidence suggests that much AF actually arises from ectopic activity in the muscular cuff surrounding the pulmonary veins where they enter the left atrium. AF is thought to beget further AF through "electrical remodelling" --- electrophysiological changes that are induced in atrial myocytes due to fast rates and the consequent calcium loading.
Note that in the above tracing of AF, the ventricular response rate seems rather slow, so we suspect that AV block has been increased using pharmacological manipulation. In uncontrolled AF, rates of about 130 or more are common.
Other causes of irregular SVT are:
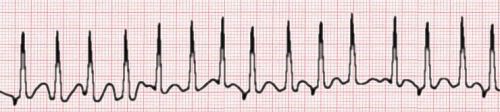
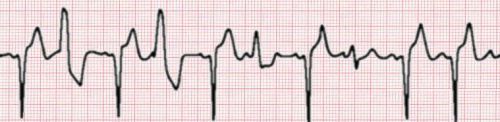
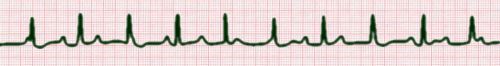
Although it looks like atrial fibrillation, the above image actually shows multifocal atrial tachycardia. Note how there are at least three different P wave configurations!
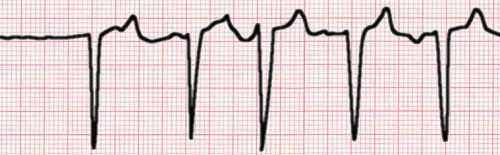
Atrial flutter is common. The atrial rate is commonly 300/min, and there is usually a 2:1 block, resulting in a ventricular response rate of 150/min. Other ratios are possible, and sometimes the ratio varies. This rhythm is often unstable, and the heart may flip in and out of sinus rhythm, or there may be runs of atrial fibrillation.
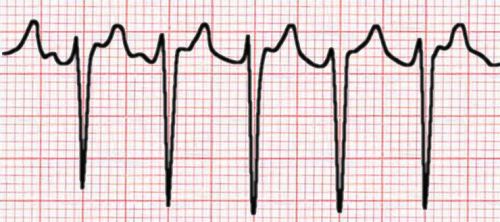
In the above ECG the clue is the rate. A rate of 150 should always engender the suspicion of atrial flutter with 2:1 block.
Probably the commonest cause of regular SVT is AV nodal re-entrant tachycardia. Here, there are generally two ways that electrical depolarisation can enter the AV node from the atrium, a slow and fast `pathway'. A re-entrant circuit can be set up, with impulses moving in a circular fashion, and causing depolarisation of the ventricles at fast rates (up to 200/min or even more).
Other causes of regular SVT include:
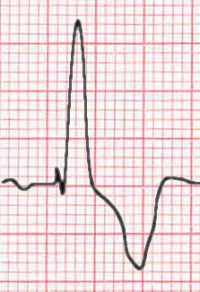
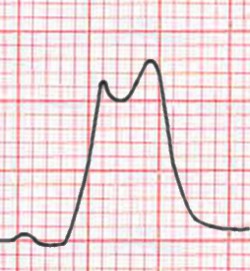
Abnormal, congenital extra pathways between the atria and ventricles are common, and can perforate the electrically insulating fibrous ring that normally separates the atrial `chamber' and the ventricular one. The most well-characterised is the Wolff-Parkinson-White syndrome. Reasonable (WHO) criteria for the WPW pattern on ECG are:
Because depolarisation moves `antegrade' from atria to ventricles, part of the ventricle depolarises prematurely, and this is responsible for the slurred, initial delta wave. It should be clear that the PR interval will therefore be short, and the QRS duration should be prolonged. Note however that not everyone with an accessory pathway will conduct all of the time down that pathway. Accessory pathways are common, estimated to occur in one to three individuals in every thousand. Symptomatic pathways are far less common.
The WPW syndrome is a combination of the WPW pattern, and tachycardias. The tachycardias may be due to impulse conduction down via the AV node and back up the accessory pathway (commonest, called orthodromic tachycardia), the other way around (down accessory pathway, up AV node, termed antidromic tachycardia), or even related to atrial fibrillation. This last cause is ominous, as if the accessory pathway is able to conduct impulses at fast rates, the ventricle may be driven at rates in excess of 200/min, causing collapse or even death.
A few pointers are in order. The important thing to look for is the P wave:
A few other hints:
Because these arise within an ectopic focus within the ventricular muscle, the QRS complex is wide, bizarre, and unrelated to a preceding P wave. There is usually a constant relationship (timing) between the preceding sinus beat and a subsequent ventricular beat, because the preceding beat influences the ectopic focus.
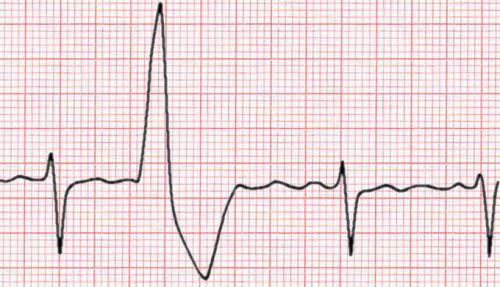
The ventricular beat is not usually conducted back into the atria. What happens to the atrial beat that occurred, or was about to occur when the VE happened? Usually, this is blocked, but the subsequent atrial beat will occur on time, and be conducted normally.
Rarely, the ventricular beat may be conducted retrogradely and capture the atrium (resulting in a P wave after the QRS, with an abnormal morphology as conduction through the atrium is retrograde). The atrial pacemaker is now reset! In the following rather complex tracing, we have a ventricular rhythm (a bit faster than one might expect, perhaps an accelerated idioventricular rhythm) with retrograde P waves, and something else --- some of the P waves are followed by a normal looking `echo' beat as the impulse is conducted down back into the normal pathways).
Because the intrinsic rate of an ectopic focus often tends to be slow-ish, extrasystoles will tend to arise more commonly with slower rates. In addition, if the rate is varying, extrasystoles will tend to `squeeze in' during long RR intervals. Some have called this the "rule of bigeminy".
Two VE's are termed a couplet.
Occasionally, a VE occurs just after a sinus beat has started to propagate into the His-Purkinje system. This results in a `fusion beat', which combines the morphology of a normal sinus beat and that of the extrasystole.
Rarely, the ectopic focus is protected from other influences, and does its own merry thing. This is termed `parasystole', and is detected by noting the unvarying coupling between extrasystoles, and the lack of coupling between the extrasystole and sinus beats! In the following trace, note the fusion beats as the normal rhythm and parasystolic rhythm transiently coincide...
We've put in the above unusual ECG more as a mnemonic than for any other reason. We want you to remember that even with extrasystoles, there is flow of information from the normal rhythm to the ectopic focus. The ectopic focus is therefore modulated by the normal rhythm, and usually occurs at about the same interval from the normal events. Parasystole is unusual.
Three or more ventricular extrasystoles are a bad sign, and are termed ventricular tachycardia (VT). There is usually severe underlying myocardial disease. Sustained VT (more than about 30 beats) often degenerates into ventricular fibrillation, resulting in death.
The above strip shows several `characteristic' features of VT. Apart from the regular fast rate and wide complexes, we have a few more clues ... clearly, the atrial rate is different from the ventricular rate, and there is dissociation between atria and ventricles --- the P waves occur at any time in relation to the QRS complexes. Even more characteristic of VT is the presence of a fusion beat at the start of the trace --- a QRS complex which is something in between the VT morphology and normal morphology. There is also a capture beat later on, where the P wave has managed to sneak through and transiently take over, resulting in a normally-shaped QRS complex and T wave.
Distinguishing between VT, and SVT with aberration is tricky. When in doubt, one should apply synchronised DC countershock, and agonize later. This is especially the case if the patient is haemodynamically unstable. If the patient is haemostable, the rate is slowish (under about 150), then one may have more time. A variety of algorithms have been proposed - Brugada's approach may have merit --- you can explore a web-based version of his algorithm here.
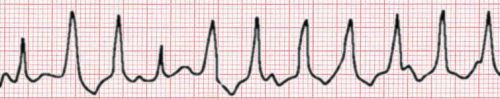
This is a chaotic ventricular rhythm that rapidly results in death. It is often precipitated by a critically timed extrasystole, that occurs during the relative refractory period of the myocardial fibres. Conventional wisdom has it that this results in chaotic, unco-ordinated wavelets of depolarisation moving through the ventricular mass.
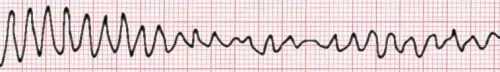
VF is a dire emergency. If unsynchronised DC countershock is applied within 30s of the onset of VF, there is an approximately 97% chance that sinus rhythm will be restored, and the person will survive. Survival decreases exponentially thereafter, with every minute of delay.
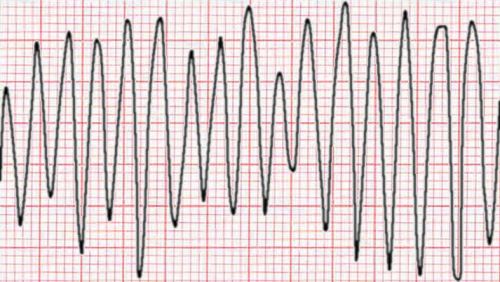
Ventricular 'flutter' is a bizarre sine-wave like rhythm, and usually degerates into ventricular fibrillation. You won't see it often (or for long).
The peculiar system we use in electrocardiography is non-Cartesian, and rather arbitrary! We measure the direction of vectors in degrees, and zero is indeed facing `East', but +90o is South, instead of North as it would be in a Cartesian system. You can work out that ± 180o is 'West', and that minus 90o is 'North'.
We can talk about the `axis' of any ECG depolarisation, but most people when they are talking 'axis' are referring to the mean frontal plane QRS axis. There is a number of ways of determining this, but the following method has the merit of simplicity:
Note in the above picture that the (abnormal) axis illustrated is negative ("towards the left") because AVF is negative.
People tend to faff quite a lot about QRS axis deviations, but they are a fairly blunt-edged tool. Marked right axis deviation (e.g. +150o) may signify significant `right-sided' heart disease. Left axis deviation is not uncommon in inferior myocardial infarction, and if this is absent, the most likely `diagnosis' is left anterior hemiblock. (There are several other cause of left or right axis deviation, for example depolarisation via accessory pathways).
Where the axis is up and to the left (eg. -135o)*, this is termed a "north west axis". It is commonly seen in congenital heart disease, dextrocardia, and sometimes in severe chronic obstructive airway disease.
The T wave axis is much neglected, and may be of value. If the T wave axis is more than about 45 to 60o different from the QRS axis, this is abnormal. Schamroth gives a super mnemonic --- "the T-wave axis moves away from the `region of mischief'".
Even the P-wave axis is of use. The normal axis is about +40 to +60o, moving right with chronic obstructive disease. The axis may move left with congenital heart disease, even up to -30o (especially Ebstein's anomaly). One can also spot an ectopic atrial focus low down in the atrium (`coronary sinus rhythm') due to the `northern' shift in axis.
*{Footnote: One reader pointed out that an axis of -135o could just as well be regarded as being `markedly to the right'. This is a reasonable argument.}
Normal atrial activation is over in about 0.10s, starting in the right atrium. A good place to look at P waves is in II, where the P shouldn't be more than 2.5mm tall, and 0.11 seconds in duration.
A tall P wave (3 blocks or more) signifies right atrial enlargement, a widened bifid one, left atrial enlargement:
|
|
In V1, another good place to look, depolarisation of the right atrium results in an initial positive deflection, followed by a vector away from V1 into the left atrium, causing a negative deflection. The normal P wave in V1 is thus biphasic. It's easy to work out the corresponding abnormalities with left or right atrial enlargement:
There are a few other tips:
The PR interval extends from the start of the P wave to the very start of the QRS complex (that is, to the start of the very first r or q wave). A normal value is 3 to 5 `little blocks' (0.12 to 0.20 seconds). It's convenient at this point to discuss blocks...
This is a diagnosis of deduction, as no electrical activity is seen. An impulse that was expected to arise in the SA node is delayed in its exit from the node, or blocked completely. A second degree SA block can be `diagnosed' if the heart rate suddenly doubles in response to, say, administration of atropine. If the SA node is blocked, a subsidiary pacemaker will (we hope) take over, in the atrium, AV node, or ventricle!
There are three "degrees" of AV nodal block:
*{Footnote: Thanks to the reader who pointed out the typo}
Clearly a bad thing, requiring temporary or even permanent pacing.
The nomenclature is mildly arcane --- small deflections are reflected using lower case, and larger deflections UPPER CASE. An initial downwards deflection is a Q (or q), any negative deflection after this is an S. An upward deflection is an R. Note that we refer to a second deflection in the same direction by adding a prime, so we have R', R'', S' and so on. We might thus refer to an rSR' morphology, or whatever.
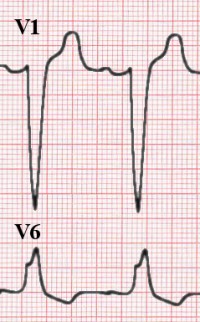
Normally, the septum depolarises before other parts of the left ventricle. This is seen as a small initial vector, which in the `septal leads' (V1 and V2) is a positive deflection, and in lateral leads (e.g. V6) is seen as a small q. This observation is of relevance, as in conditions such as left bundle branch block, where the septum cannot depolarise normally, the lateral (septal) q is conspicuously missing.
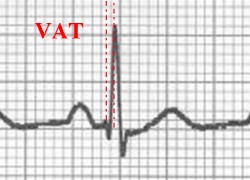
Something of some importance is the time it takes the ventricle to depolarise, often termed the ventricular activation time. We can estimate this from the surface ECG by looking at the time from the onset of the QRS to the sudden downstroke of the QRS. (The fancy name for this sudden downstroke is the `intrinsicoid deflection'). In right orientated leads, a normal VAT is 0.02s, and on the left (e.g. V6) the duration should not exceed 0.04s.
|
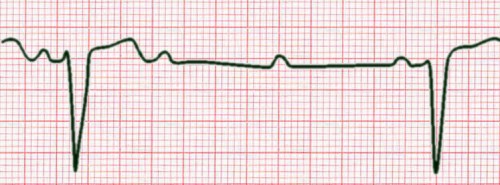
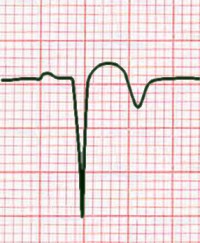
Many people who have had a prior MI will have an ECG that appears normal. There may however be typical features of previous MI, and the most conspicuous of these is Q waves. A simplistic explanation of these prominent Q waves is that an appropriately placed lead "sees through" the dead tissue, and visualises the normal depolarisation of the viable myocardial wall directly opposite the infarcted area. Because, in the normal myocardium, depolarisation moves from the chamber outwards, this normal depolarisation is seen as a Q wave! Another feature of previous MI is loss of R wave amplitude. It's easy to imagine that if muscle is lost, amplitude must be diminished. (Having a pre-infarction ECG for comparison is invaluable). |
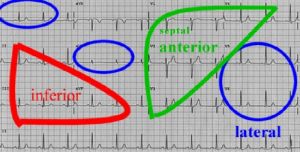
One can get some idea of the site of infarction from the lead in which abnormalities are seen - inferior, lateral, or anterior.
Because of the thin-walled nature of the atria, from an ECG point of view, one cannot talk about "atrial hypertrophy" but only about enlargement. Conversely, thickening of the ventricle may result in increased voltages seen on the surface ECG, and we can then discuss "ventricular hypertrophy".
The absence of LVH on ECG means nothing, as the features are insensitive. If however they are present, LVH is very likely. Because the criteria were formulated on white males, they are very insensitive in e.g. black women.
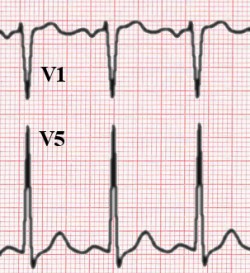
Systolic overload results in increased QRS deflections, with the sum of the S in V1 and the R in V5 or V6 over 35mm indicating hypertrophy. (In the above picture, also note the predominantly negative deflection of the P wave in V1, suggesting left atrial enlargement). A host of other criteria have been proposed. Useful are:
T wave axis changes can be predicted knowing Schamroth's rule .
Features of LVH may be present (as above). Enormous R waves may be seen in left-sided leads, especially with aortic or mitral regurgitation. In contrast to systolic overload, where septal q waves in the lateral leads are often diminished or absent, in diastolic overload, prominent lateral Qs are noted. Unlike systolic overload (where the T waves are often inverted), T waves are usually upright, very symmetrical, and somewhat pointed.
Inverted U waves in V4-6 suggest either systolic or diastolic LV overload.
A number of ECG abnormalities have been associated with right ventricular hypertrophy. These include:
Whenever you see a tall R in V1, consider the following differential:
A broadened QRS complex suggests a bundle branch block, although there are other causes:
Diagnostic criteria for right bundle branch block are somewhat empiric, but useful. Here they are:
In addition, there is usually a prominent S in the lateral leads (I, V5, V6).
RBBB is sometimes seen in normal people, or may reflect congenital heart disease (e.g. atrial septal defect), ischaemic heart disease, cardiomyopathy, or even acute right heart strain.
Diagnose this as follows:
In addition, the VAT is prolonged, and tall, notched R waves are seen in the lateral leads (RR' waves). There is usually a notched QS complex in V1 and V2.
Left anterior hemiblock (LAHB) is interruption of the thin anterosuperior division of the left bundle. Suspect it if there is left axis deviation (past -45o) without another cause (such as inferior myocardial infarction, or some types of congenital heart disease or accessory pathways).
Other features of LAHB include an initial QRS vector which is down and to the right, a long VAT, and several other minor changes.
LAHB may indicate underlying heart disease, but is much more worrying when associated with other abnormalities (such as PR interval prolongation or RBBB).
The diagnosis of left posterior hemiblock is mentioned only to be avoided!
Besides sinus bradycardia, the most common finding is a prominent J wave.
In addition, there may be delayed VAT , QRS prolongation, and nonspecific T wave abnormalities, with QT prolongation. Eventually, blocks, ventricular extrasystoles, and finally ventricular fibrillation occurs, below 30oC.
One should always remember that more than a quarter of people presenting with an acute myocardial infarction will have no ECG evidence of ischaemia or infarction! The ECG on its own is a blunt-edged tool in the detection of coronary artery disease. Exercise testing to elicit ischaemia is also not very sensitive in detecting this common disease.
There are four main features of early myocardial infarction (as per Schamroth):
Note that Q waves are not seen early on.
|
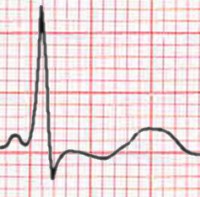
We now lay great emphasis on ST segment elevation in diagnosing acute MI (In the past, Q waves were remarked on, but as noted above, these are often absent, early on). The features of `full blown' MI may be:
Remember our previous warning, that a significant proportion of people having an acute MI will have a normal ECG, so do not rely on any of these features to exclude MI. |
The trick in diagnosing this is to realise that posterior wall changes will be mirrored in the leads opposite to the lesion --- V1 and V2. S we'll see a tall R (corresponding to a Q), ST depression, and upright arrowhead T waves:
This occurs in about 1/3 of patients with inferior MI, but is often missed. It would be distinctly unusual in the absence of inferior MI. Sensitivity can be improved by looking at V4R --- V4, but put the lead on the right side of the chest! Look for ST elevation which is higher than that in V1 -- V3. Another suggestive feature is lack of ST depression in V1 with evidence of MI in the inferior leads (look for ST depression in V2 under 50% of the ST elevation in AVF).
There are no reliable correlates of "subendocardial" or non-ST elevation MI, and the diagnosis is based on the combination of clinical and laboratory criteria (troponin elevation being important). There may be no ECG changes, or even ST segment depression and/or T wave abnormalities.
The most important component of an effort ECG that indicates the presence of coronary artery disease is where exercise reproduces the patient's chest discomfort or pain. Other findings may be:
Did you notice the ST segment depression in our section on voltage and timing, above?
The simple (and possibly even correct) explanation of why you see ST segment elevation with this variant form of angina is that the predominant area of ischaemia is epicardial. This disorder is thought to be related to vascular spasm, and angiography shows coronaries without a significant burden of atheroma. Many other morphological abnormalities have been described with this disorder.
This is common --- ST segment elevation is conspicuous, often with a prominent J wave. It has been remarked upon in athletes, particularly. It's important to relate the ECG to the clinical context, as always, as otherwise one might inappropriately suspect serious underlying heart disease.
T wave abnormalities are common and often rather nonspecific. T-wave changes that suggest ischaemia are a very sudden junction between the ST segment and the T wave, and very symmetrical T waves. A variety of changes may be seen with cardiomyopathies, intracranial haemorrhage and so on. Symmetrical deep T-wave changes most prominent in V3 and V4 suggest ischaemia in the territory of the left anterior descending artery (LAD T0-waves). We should all know the features of hypo- and hyper-kalaemia.
Initial features are tall "tented" T waves. Later, despite the continuation of sinus rhythm, the P waves disappear, and finally, the QRS complexes broaden and become bizarre, the ST segment almost vanishes, and the patient dies from ventricular arrhythmia or cardiac standstill.
For features of hypokalaemia, see below .
This is the time from onset of QRS to end of T wave. Because QT varies with rate, it is common to apply a correction, usually using Bazett's formula:
        QTc =       QTmeasured
              ---------------------
                SQRT (RR interval)
SQRT refers to the square root. A normal value is about 0.39s ±0.04s (slightly larger values are acceptable in women). Be particularly concerned if the value is over 0.5, as may be seen in poisoning with tricyclic antidepressants, congenital QT syndromes, hypocalcaemia, and toxicity from a variety of other drugs (quinidine, procainamide, amiodarone, sotalol, erythromycin, etc). Other cause have been reported, including hypothermia, head injury, acute myocardial infarction (!), and hypertrophic cardiomyopathy.
The T waves flatten, U waves become prominent (this may be falsely interpreted as QT prolongation), and there may even be first or second degree AV block.
Common findings are tachycardia, heart blocks (first degree, LAHB), and increased VAT . A variety of ST changes may be seen, including those of myopericarditis. Atrial and ventricular extrasystoles are common.
Pericarditis is usually associated with a degree of contiguous myocarditis. The major manifestation is widespread ST segment elevation.
There is also usually sinus tachycardia, and T wave abnormalities are common.
The most common finding here is simply diminished amplitude of the ECG deflections. There may also be T wave inversion, and sometimes one sees electrical alternans .
Apart from sinus tachycardia, ECG abnormalities are not common. The `classical' S1Q3T3 syndrome occurs in under 10%. Other features may be those of right atrial enlargement, RV hypertrophy or ischaemia, RBBB and atrial tachyarrhythmias.
ST segment changes are pretty characteristic, with their "reverse tick" conformation. These changes are not indicative of toxicity, but merely the presence of digitalis. With toxicity, practically any arrhythmia can be seen, although certain arrhythmias are highly suggestive, for example, the presence of both increased irritability and AV nodal block (such as paroxysmal atrial tachycardia with a 2:1 AV nodal block).
Here, there is no rhythm disturbance, but the QRS amplitude alternates --- tall one beat, shorter the next (and so on...). At fast rates, this is said to be of little significance, but at slower rates usually signifies severe heart disease, or pericardial effusion.
A good general reference is Leo Schamroth's An Introduction to Electrocardiography, published by Blackwell Scientific. (7th Ed., 1990, ISBN 0-632-02411-9). It has the merits of clarity, accuracy and depth. Leo was one of the truly great men of electrocardiography, and a brilliant physician, to boot.
A site we've encountered which shows promise is Learn The ECG. It's free, interactive and provides a reasonable, basic approach to the ECG.
| Date of First Publication: 2003/7/4 | Date of Last Update: 2006/07/24 | Web page author: Click here |